David Robinson has done several screencasts where he analyzes a Tidy Tuesday dataset live. I have listened to a few of them and found them very interesting and instructive. As I don’t use R on a daily basis, I have not kept up with what the latest is in Tidyverse. So when I listened to his screencasts, I learnt functions that I was not aware of. Since I sometimes forget which function I learnt, I wanted to extract all the functions used in the screencasts so that it is easier for me to refer to the ones that I am not aware of but should learn.
The approach I took is:
- Get all the Rmd analysis files from the screencast github repo.
- Extract the list of libraries and functions used in each .Rmd file
- Plot frequencies of function use and review functions that I am not aware of
The html file with all the code and results is in this location. The R file used to generate the html file is here.
The plot below shows the how many analyses used a particular package. 
The top library as tidyverse is to be expected. It is interesting that lubridate is second. I can see that broom is used quite a bit since after exploratory analysis in the screencast, David explores some models. There are several packages that I was not aware of but I will probably look up the following: widyr, fuzzyjoin, glue, janitor, patchwork and the context in which they were used in the screencast.
The plot below shows the number of functions used from each package. 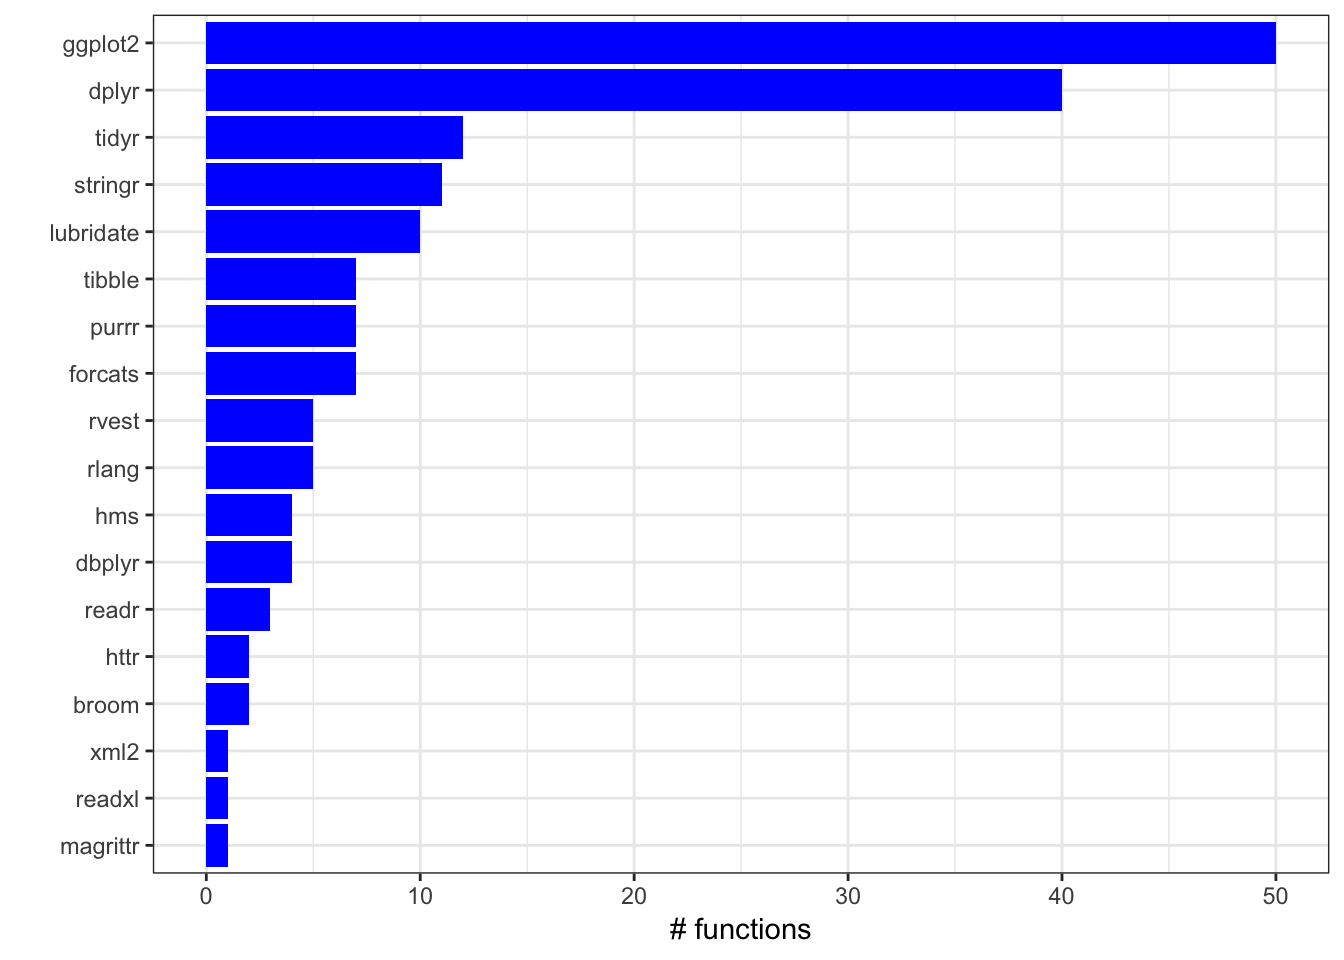
As expected, most used functions are from ggplot2, dplyr, tidyr since there is lot of exploratory analysis and visualization of data in the screencasts.
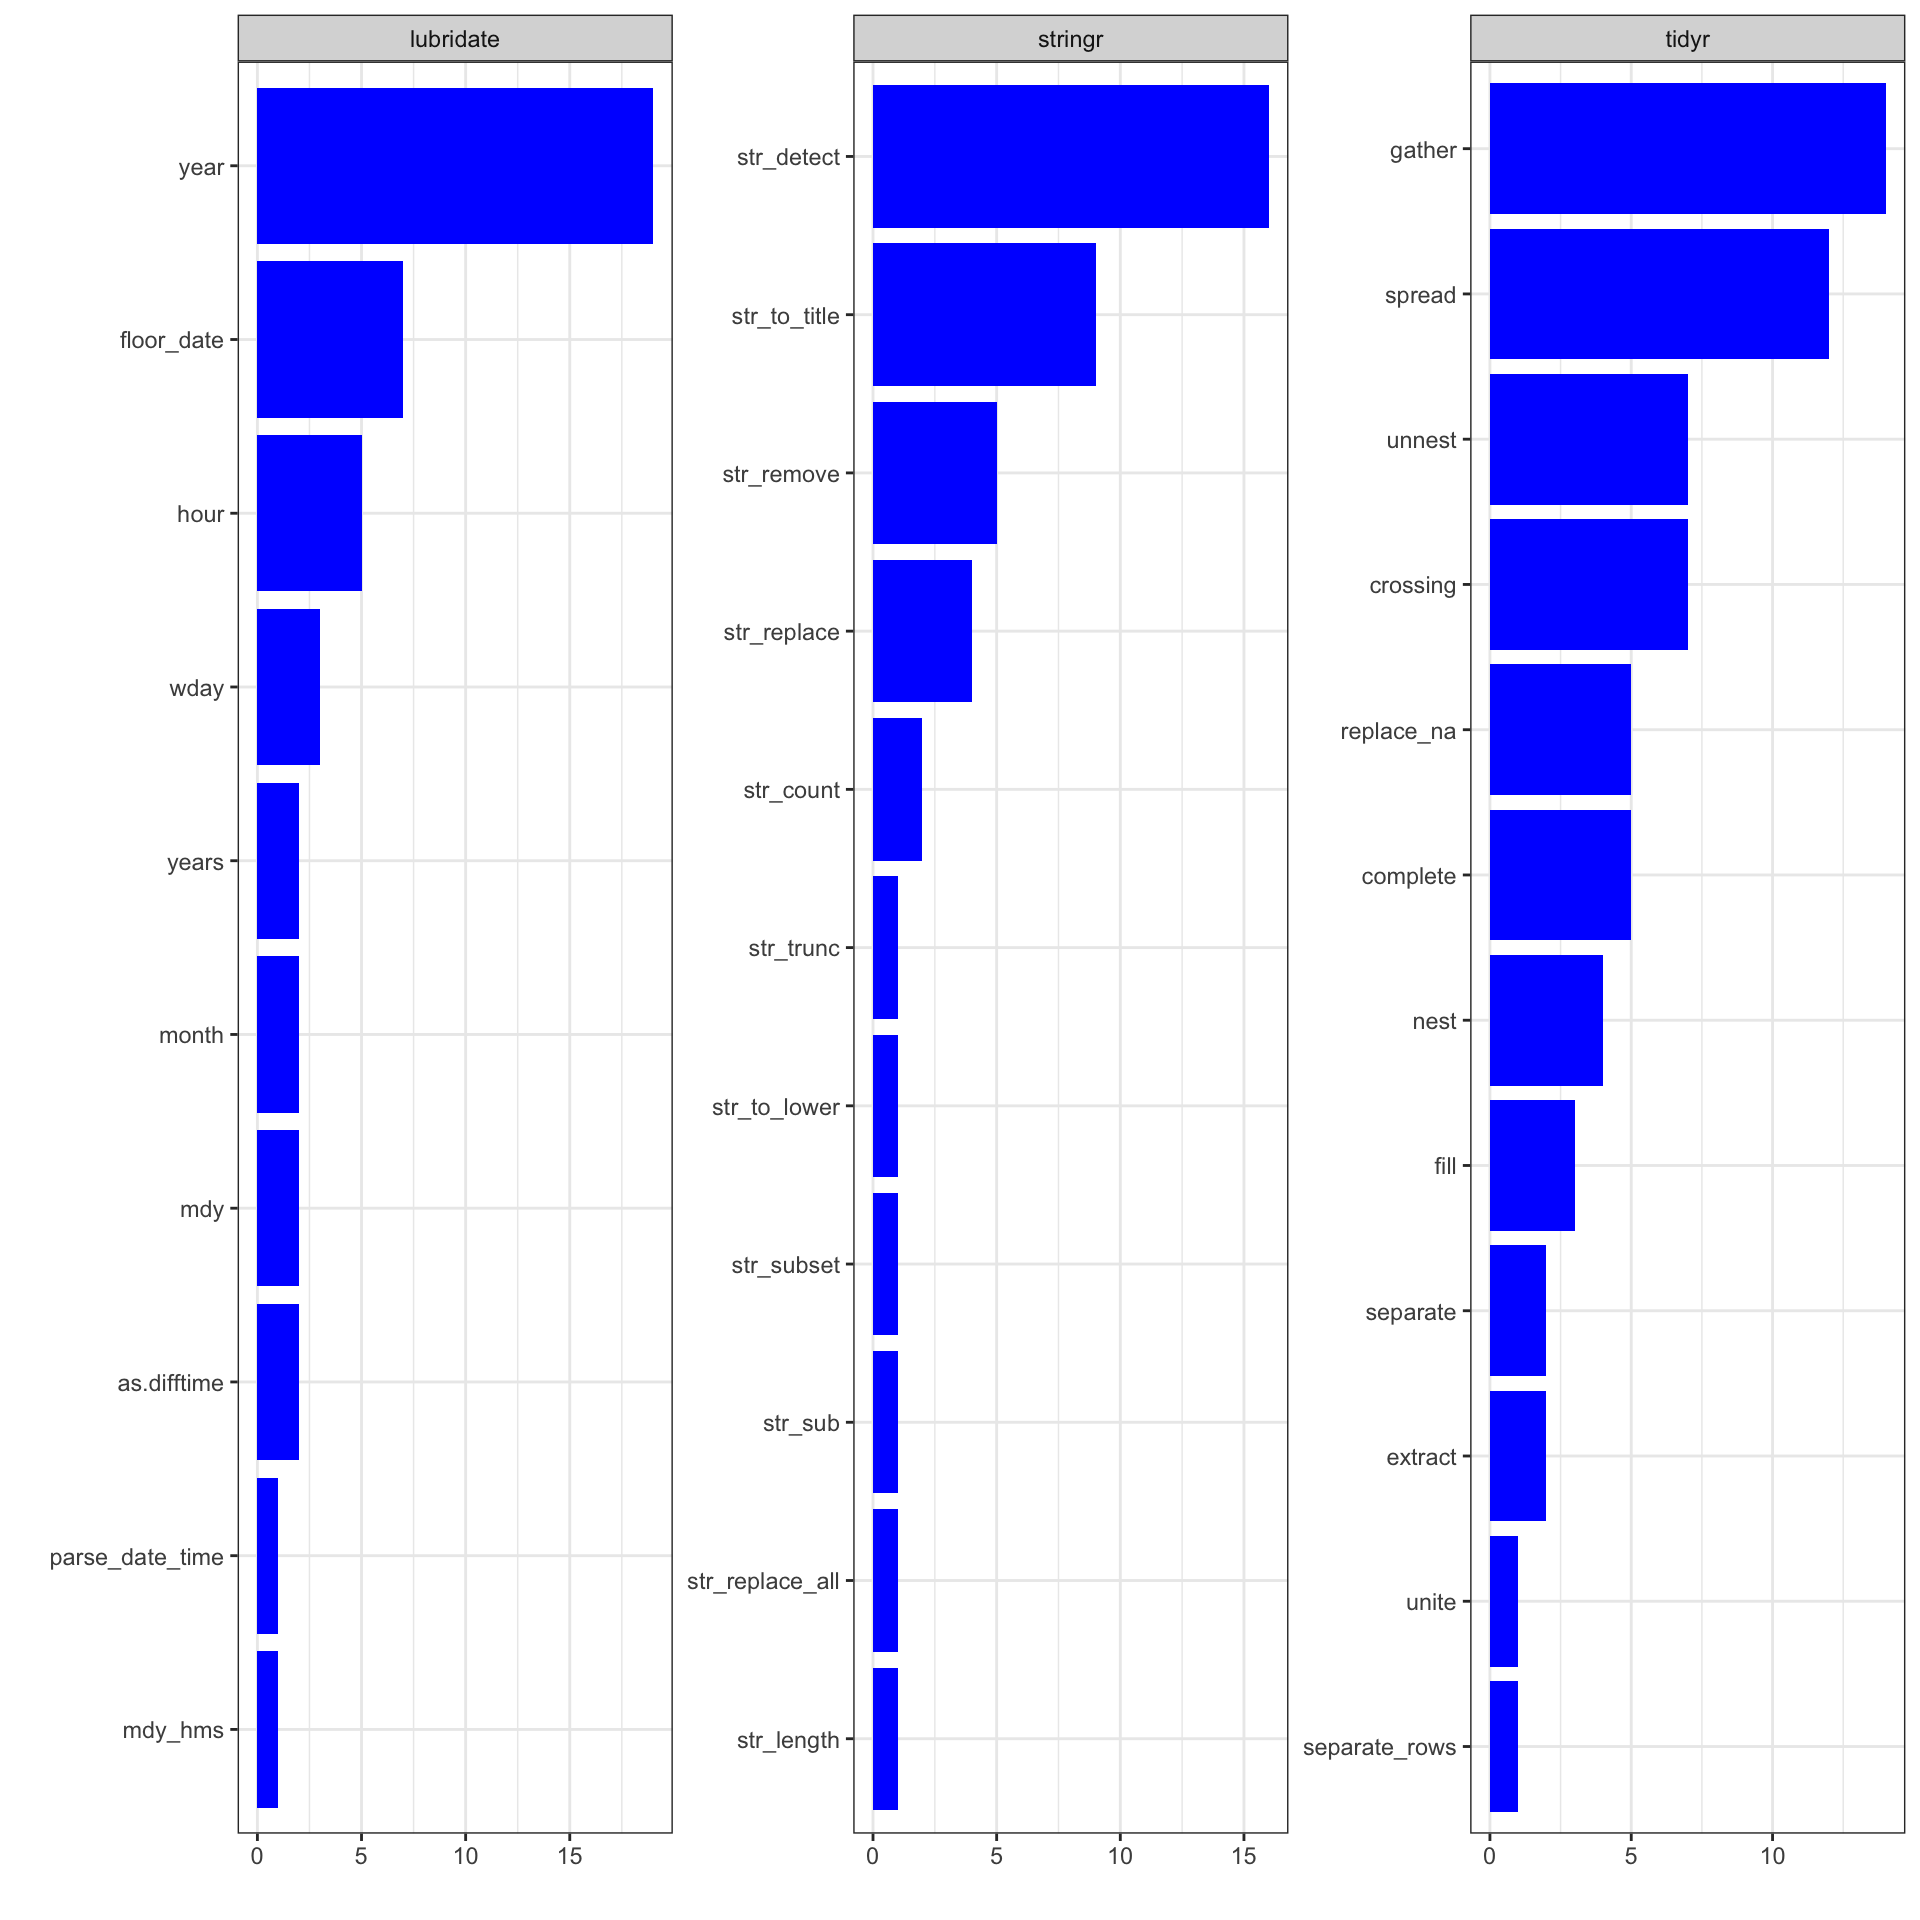
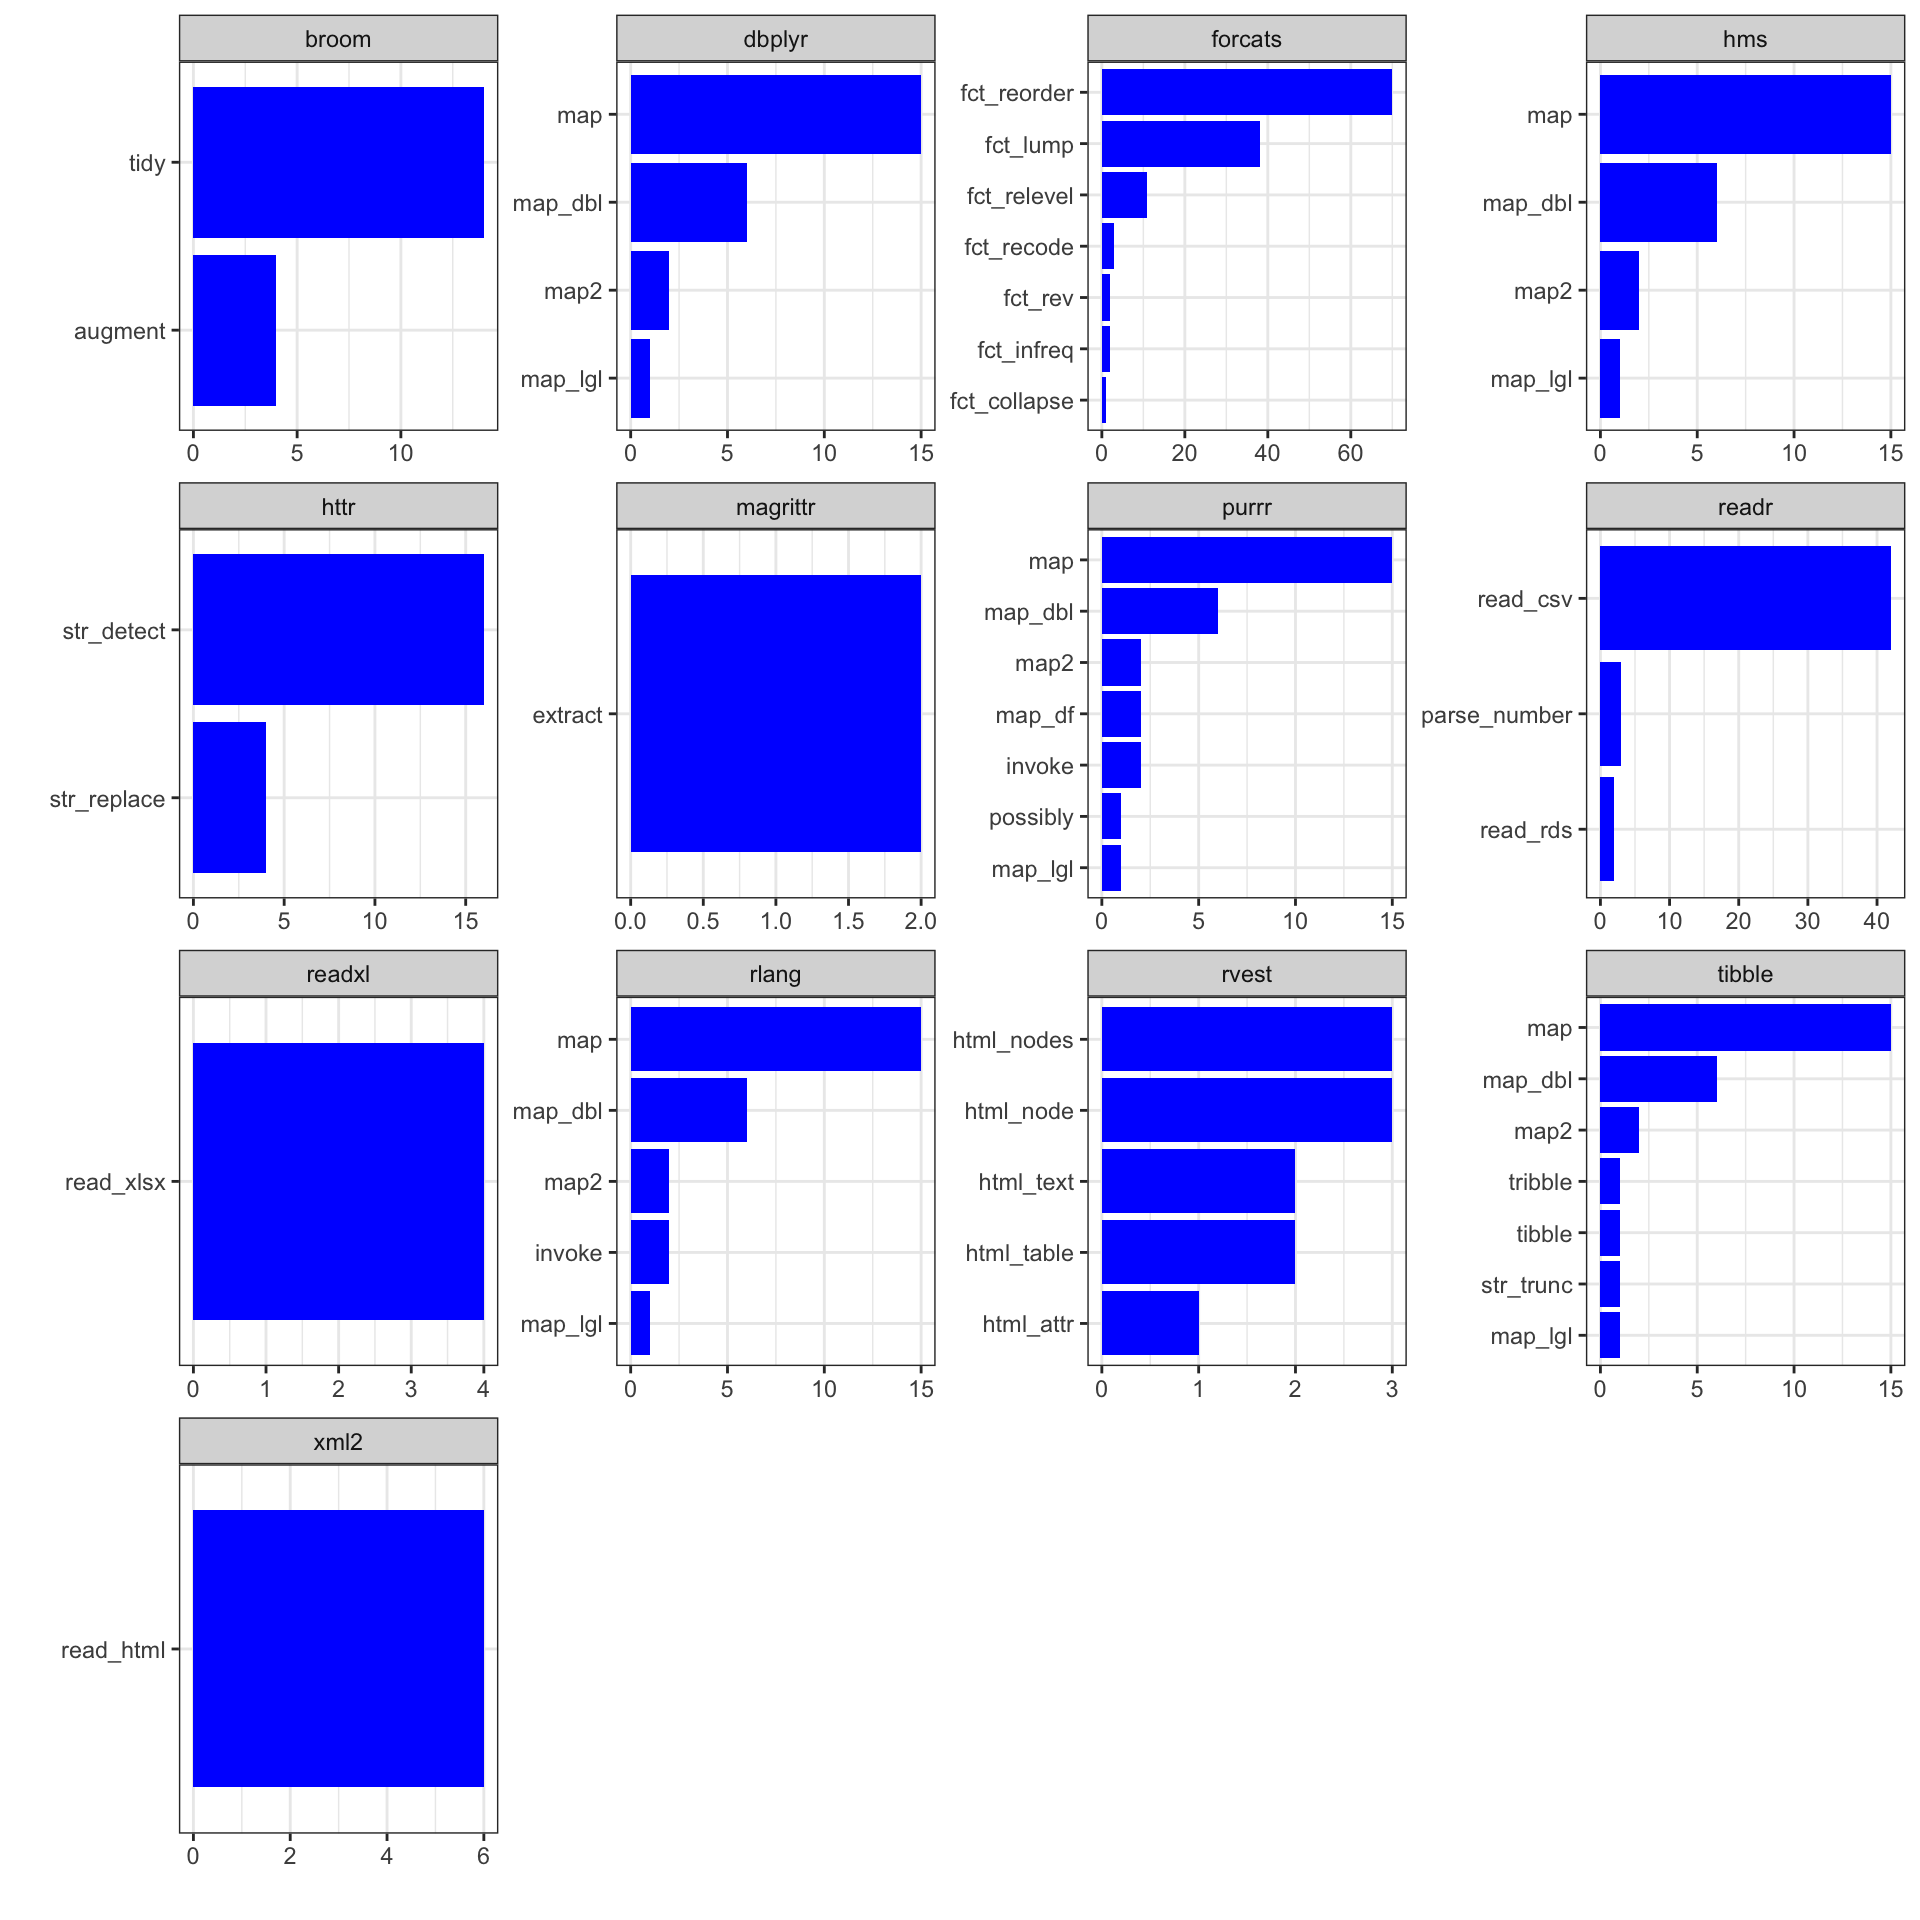
The next series of plots shows the individual functions used from the packages.
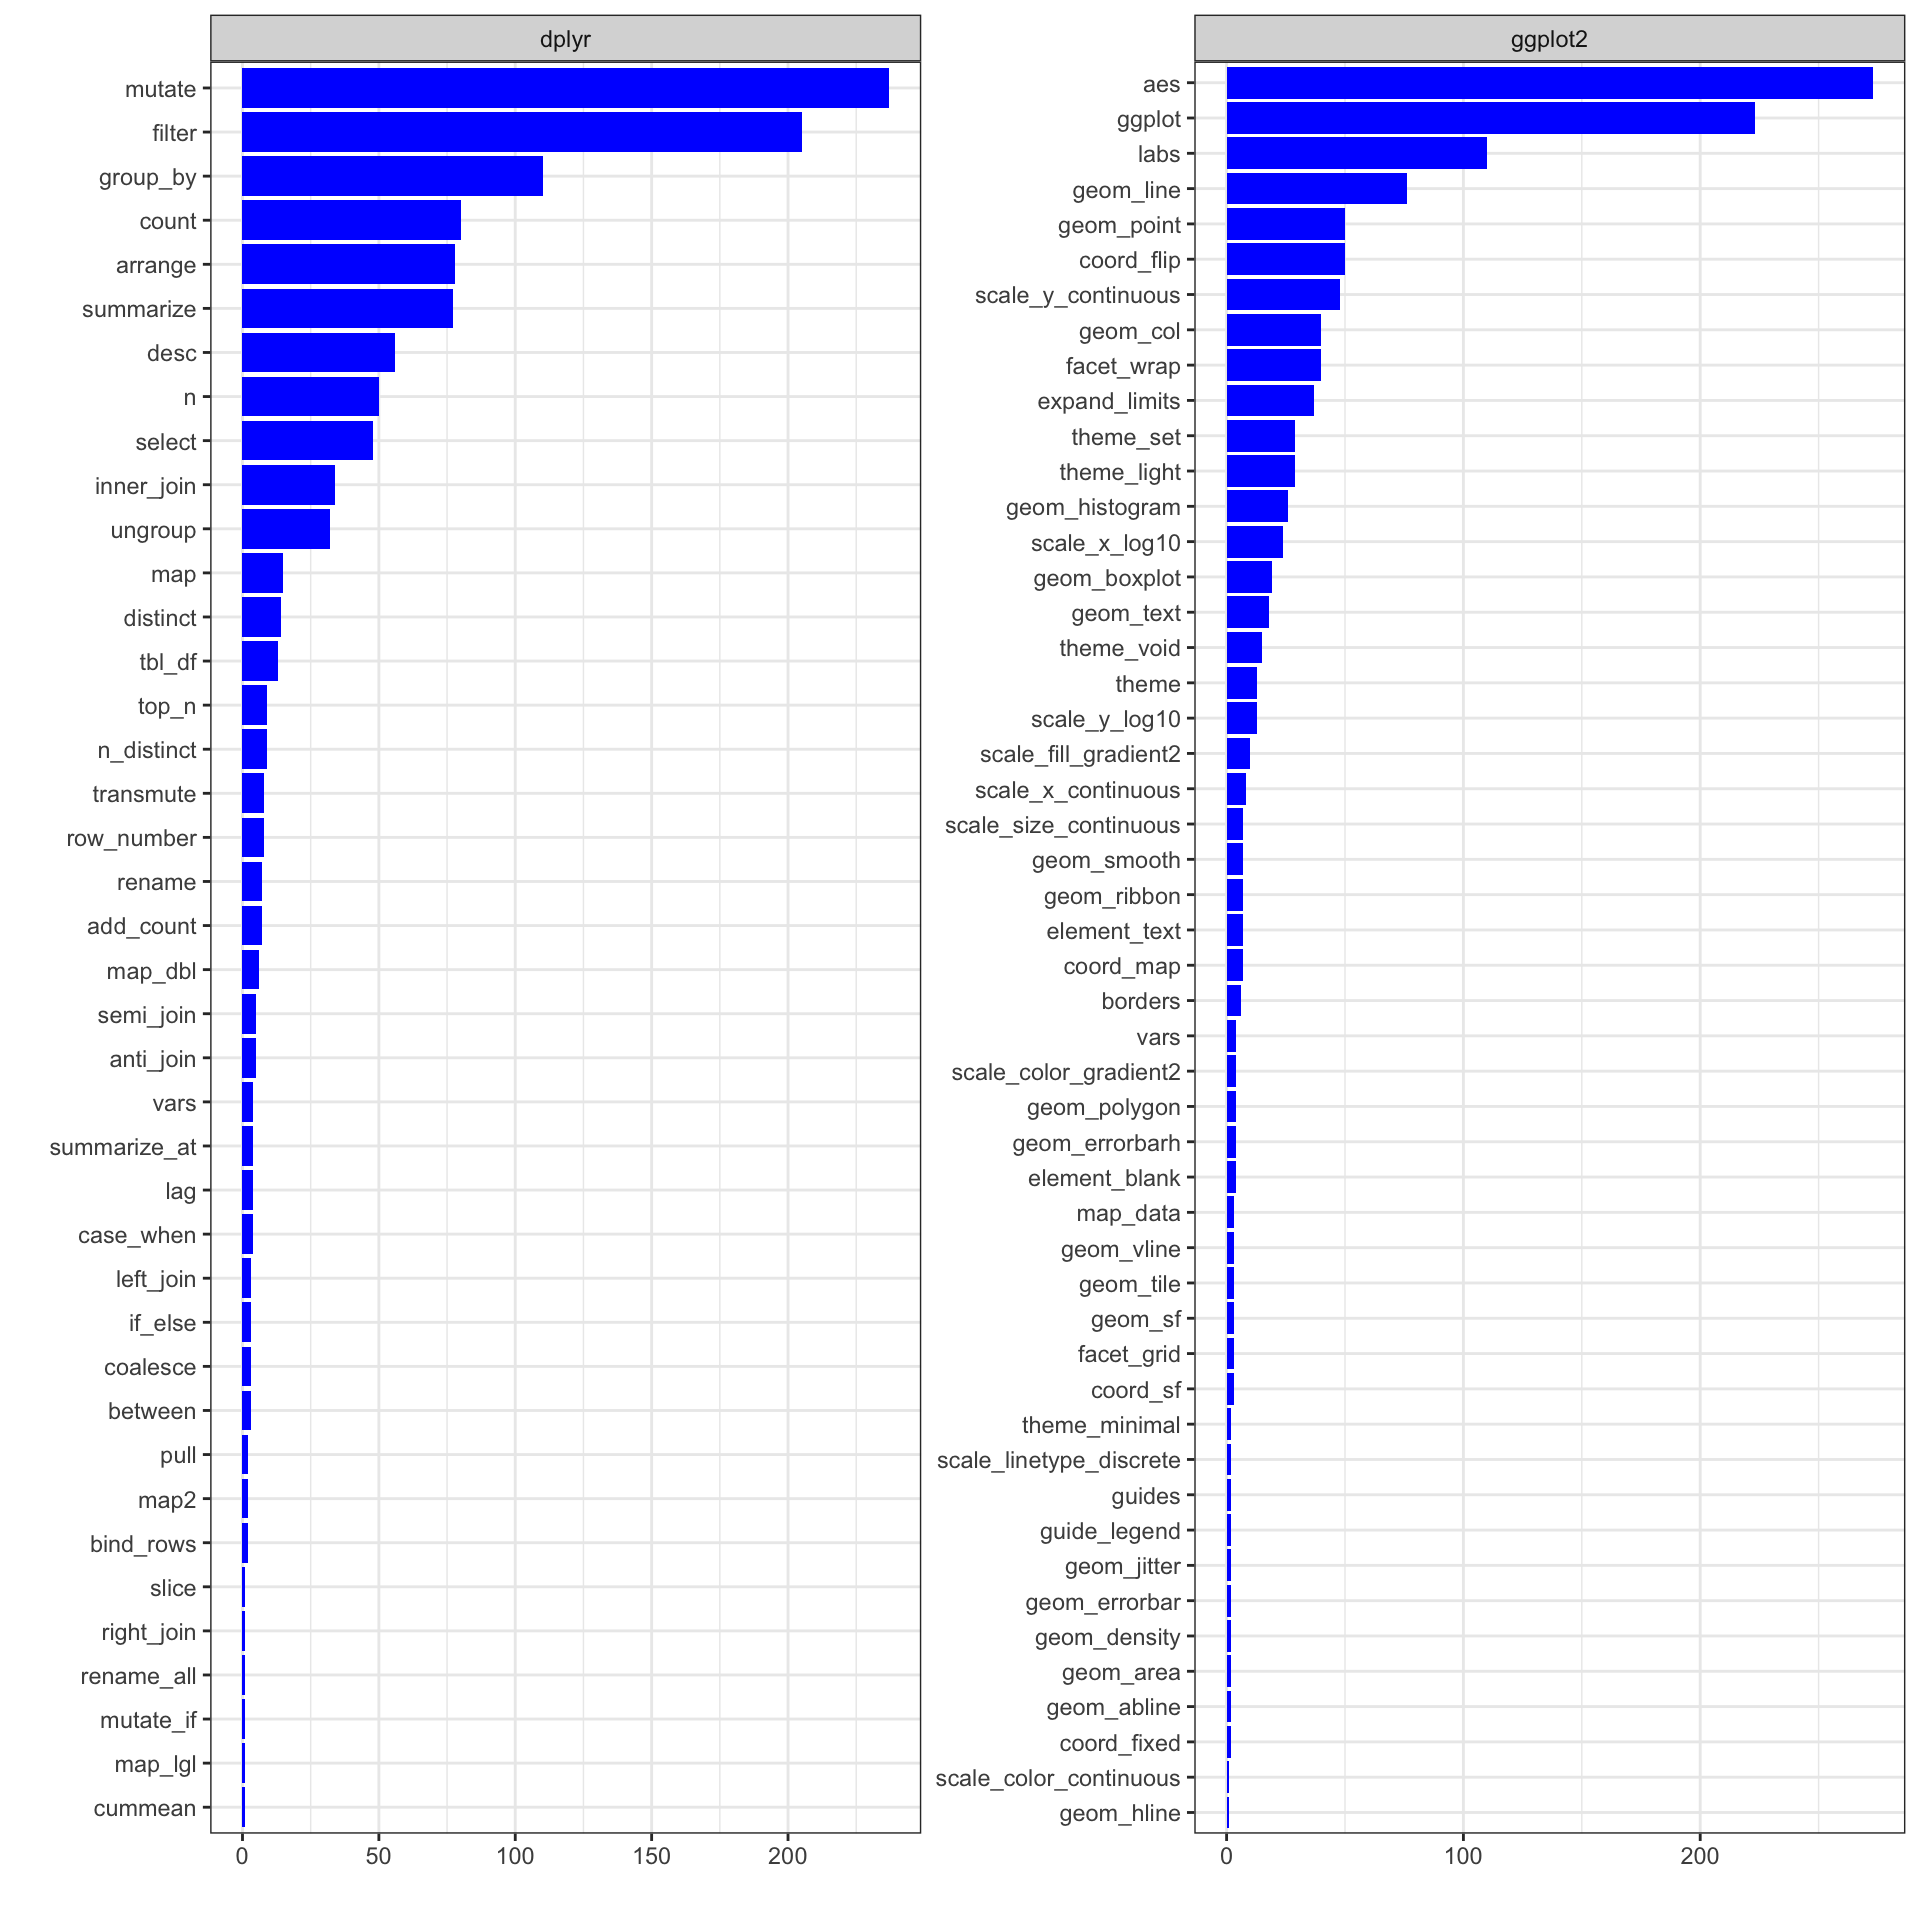
Based on the above figures, I am listing below some functions that I was not aware of and should learn
- count function in dplyr as a easier way to count for each group or sum a variable for each group.
- geom_col function in ggplot2 for bar graphs
- I became aware of forcats package for working with factors. fct_reorder and fct_lump from the package were used frequently.
- tidyr functions - nest/unnest, crossing, separate_rows
- I realized that I know only a few functions in stringr and should learn more about several functions that were used in the screencast.