Recently, Instacart released a dataset of ~3 million orders made by ~200,000 users at different days of week and times of day. There is also an ongoing Kaggle competition to predict which products a user will buy again. My goal here is more modest where I just wanted to explore the dataset to find patterns of purchasing behaviour by hour of day, day of week and number of days prior to current order. An example of this kind of analysis is also shown in their blog. Here I wanted to explore if I can find such kind of patters by using the very common and popular dimension reduction technique - Principal Component Analysis (PCA). There are several great resources that introduce PCA if you are not familiar with PCA. One of the resources is the set of video lectures on machine learning by Prof. Hastie and Prof. Tibshirani.
The general approach that I have followed is:
- Do principal component analysis on the data (each row is a product, each column is a time period (hour of day, day of week or number of days prior to current order))
- Review the loading plots of first two principal components to see purchase patterns
- Identify top 20 products that have high scores in either first or the second principal component
- Check the purchasing pattern by checking the average number of orders for the products that were identified as having top scores in one of the principal components.
Spoiler Alert: Since my analysis is basic, don’t be disappointed if there are no big Aha moments (there will be none). But I think it is still fun to see how we can extract such information directly from data.
I downloaded the data from the following link. The data dictionary is in the following link. The full code with results is in the following location.
Below are some basic info on the datasets
- The number of users are ~200,000.
- The number of orders are ~3.4M. The number of products are ~50K or which ~5K account for 80% of total orders
PCA to find patterns of purchase by hour of day
The goal here is to find products with different patterns of purchase timing by hour of day with PCA. Dataset for PCA has for each product (rows), the percentage of product orders at each hour of day (column). Since all the data is in percentages, I didn’t do any further scaling of data.
The plot of cumulative variance shows that first component accounts for 44% of variance, first two account for 58% and first 3 account for 67% of variance.
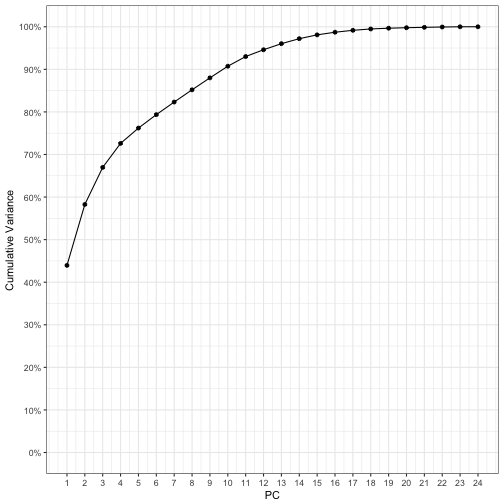
Next, we will look at the first two loadings since first 2 components account for 58% of variance.
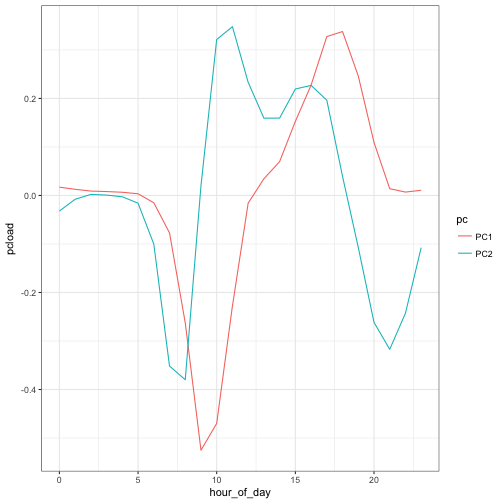
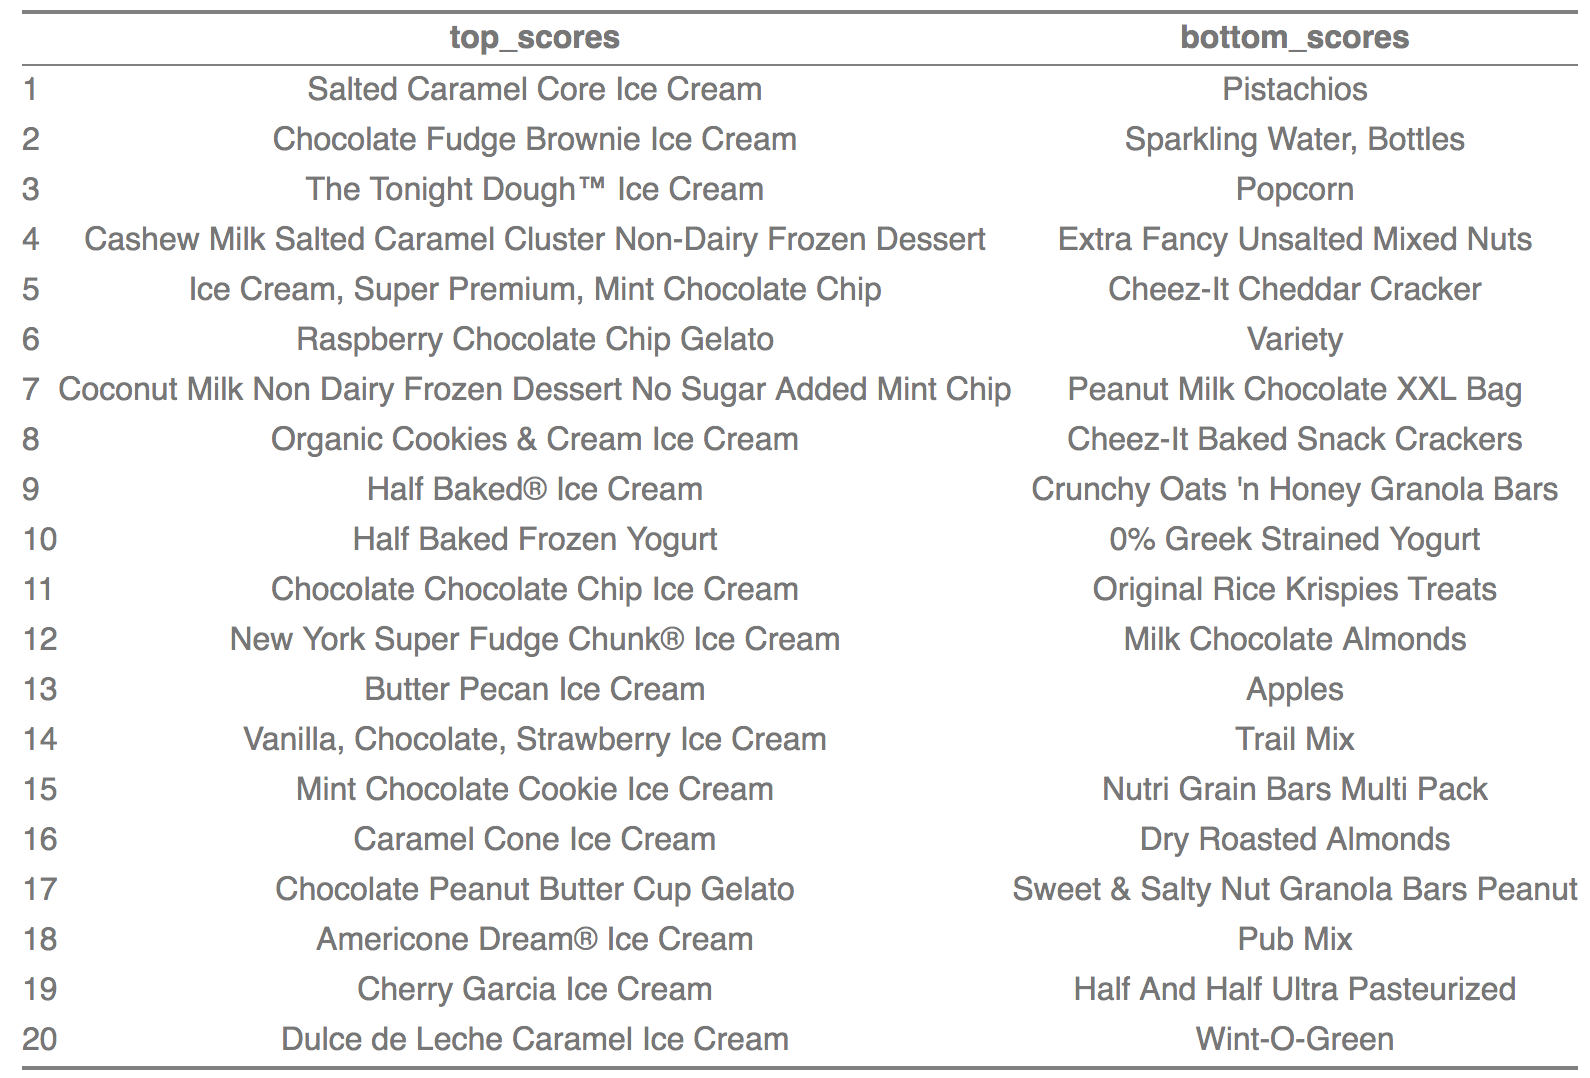
First principal component loading PC1 indicates a pattern of either higher percentage of purcahses in the morning or evening. The second principal component loading indicates a pattern where there is higher purchase around 11am and 4pm. To check which product items follow these patterns, we look at products that either have high scores or low scores on a principal component. So here we take the top 20 and bottom 20 products in terms of their scores on PC1. The actual pattern still may not quite match the loading plot since the overall pattern is a combination of all principal component loadings.
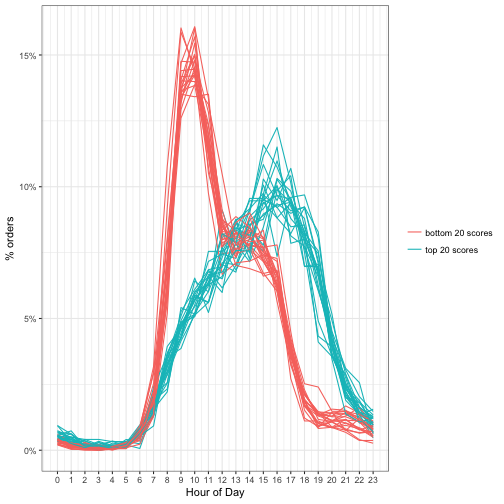
Below is the table that lists the actual products that are in top and bottom scores of PC1. Ice cream purchases tend to occur more in the evening. Items like granola bars, krispie treats, apples are purchased more in the morning.